Figure - Gram Envelope Comparison
Purpose
Compare Gram-positive vs Gram-negative envelopes and connect structure → stain color → drug/target implications.
Used In
Illustration
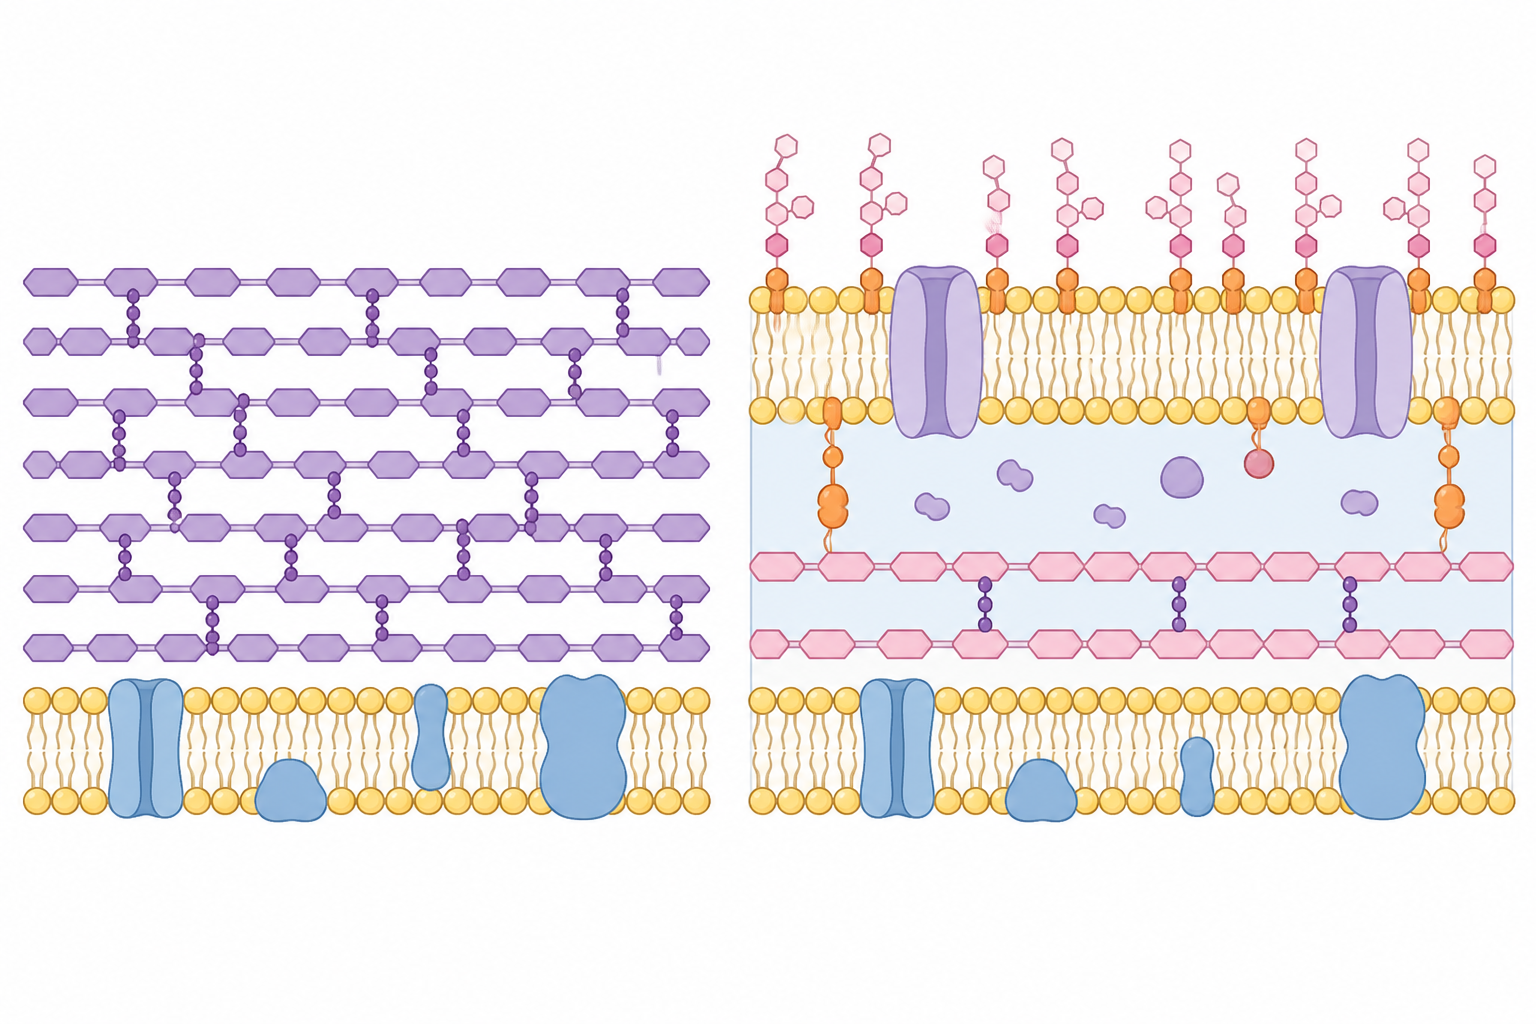
Left: Gram-positive — thick peptidoglycan over a single membrane. Right: Gram-negative — thin peptidoglycan in the periplasm, plus an outer membrane with porins and LPS. Conceptual schematic, AI-generated and reviewed; see Image Sources and Attribution. Not a micrograph.
Diagram
flowchart TB
  subgraph GP[Gram-positive]
    GP1[Capsule optional]
    GP2[Thick peptidoglycan + teichoic acids]
    GP3[Plasma membrane]
    GP1 --> GP2 --> GP3
  end

  subgraph GN[Gram-negative]
    GN1[Capsule optional]
    GN2[Outer membrane + LPS]
    GN3[Thin peptidoglycan in periplasm]
    GN4[Plasma membrane]
    GN1 --> GN2 --> GN3 --> GN4
  end

  GP -->|Crystal violet-iodine retained| PURPLE[Stains purple]
  GN -->|Decolorized then safranin| PINK[Stains pink/red]
Teaching Legend
| Layer | Gram+ | Gram− | Why it matters |
|---|---|---|---|
| Peptidoglycan | Thick | Thin | Stain retention; β-lactam target |
| Outer membrane | Absent | Present + LPS | Permeability barrier; endotoxin |
| Teichoic acids | Present | Absent | Surface charge / immune interactions |
Quick Self-Check
- Which layer traps the CV–I complex?
- Why do mycobacteria break this figure’s assumptions?